Sorry, but you do not have permission to view this content.
blog sample
Glossary
This glossary pulls together common pharmaceutical terms. Terms range from those used in forecasting, to more general pharmaceutical terms. Simply select the letter from the options, and the correlating terms and definitions will be shown underneath. Please note terms will need to be expanded to show definitions.
Uptake Analyser
Accounting for chronic patients in your forecast
In our latest series of blogs, we’ll be sharing tips and insights gained over the course of our many years of experience.
This post will look at Oncology Forecasting, and accounting for chronic patients in your forecast.
We’ll now hand over to Kris Barker, Senior Consultant here at J+D Forecasting:
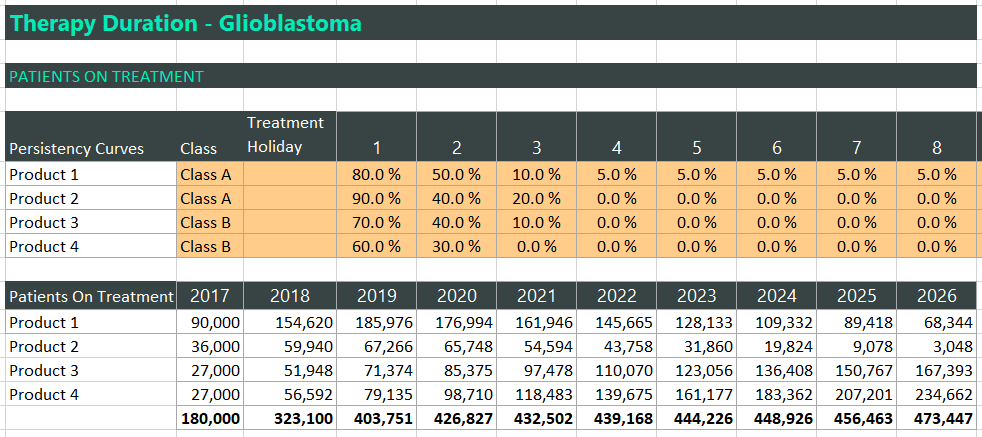
It may well be the case that you have patients who are expected to remain on treatment indefinitely, and hence you need to factor this chronic treatment of patients into your forecast model. With an Onco+ forecast, the easiest way of doing this is to use the ‘persistency curve’ feature within the Therapy Duration section. In this section of your model, you are effectively taking your incident patients at each time period from your Events section, and converting these to ‘patients on treatment’ at each time point using either average length of treatment or persistency curves. Using persistency curves, you can more accurately model the length of time that patients remain on treatment and, if you are needing to model a proportion of patients who receive the treatment indefinitely, then you can make sure that the persistency curve value remains above 0%. In the example below, you can see that for Product 1, there are 5% of all patients treated with this product who remain on this treatment for the duration of the forecast period (whilst all other treatments see the persistency drop to 0%, i.e. no chronic treatment).
Compliance Analyser
Prescriber Universes
Global Hospital Universe
Profit&Loss Template
Data Sources
Linking an NPV to your sales forecast
In our latest series of blogs, we’ll be sharing tips and insights gained over the course of our many years of experience.
The first three of these will focus on Sales Forecasting, and how linking your forecast to a Profit & Loss account, determining Net Present Value can make for much better evaluation of opportunities.
We’ll now hand over to Kris Barker, Senior Consultant here at J+D Forecasting:
As with many a forecast, the resulting outputs may well be used to drive a go/ no-go decision with regard to progressing the development of as asset or purchasing an asset from another company. To help with this decision, senior management will require more information than just the predicted net sales from your forecast model.
They will need to understand the cost of generating these sales, be it cost of goods, distribution costs, sales force costs etc. And ultimately, they will need to understand the present day value of the future cash stream so that they can compare the opportunity with others that they may be considering at the same time.
As a result, linking your forecast to a profit and loss account that helps you to clearly and consistently present your ‘opportunity’ to senior management is important. This can also be a good way of engaging other colleagues (e.g. finance) into the forecasting process. Ultimately, for the evaluation of a go/ no-go decision, the Net Present Value (NPV) of any opportunity will need to meet the internal requirements of each specific organisation.
In the screen shot below, you can see the calculated NPV for a particular asset. If the internal requirement is that any future opportunity needs to have a positive NPV, then this asset is worth considering. If the internal requirement is that any future opportunity needs to have an NPV of at least $10m, then this asset may not be worth considering.
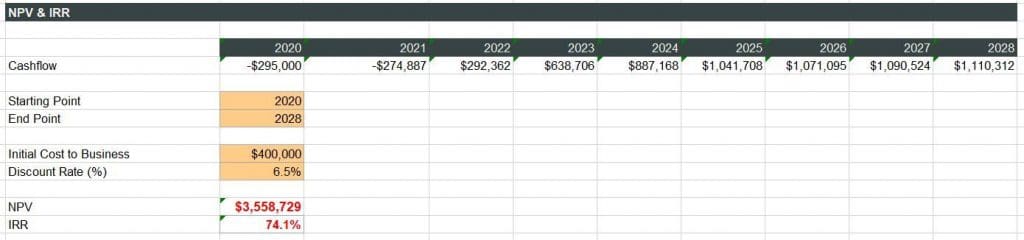
Feel free to download an example model that links a P&L (including NPV) to the forecast model itself. Please note that linking a P&L to your forecast can be done using any of the FC+ addins.
Glossary
The link above provides you with an NPV Calculator to be used in Microsoft Excel. Here are definitions and more information on some of the terms used in Kristian’s post above.
Net Present Value (NPV)
Net present value (NPV) is the difference between the present value of cash inflows and the present value of cash outflows over a period of time. NPV is used in capital budgeting and investment planning to analyze the profitability of a projected investment or project. Source
Positive Net Present Value
The purpose of net present value is to help analysts and managers decide whether or not new projects are financially viable. Essentially, net present value measures the total amount of gain or loss a project will produce compared to the amount that could be earned simply by saving the money in a bank or investing it in some other opportunity that generates a return equal to the discount rate. If a long-term project has a positive net present value, then it is expected to produce more income than what could be gained by earning the discount rate, which means the company should go ahead with the project. Source
Negative vs Positive Net Present Value
If the net present value of a project or investment, is negative it means the expected rate of return that will be earned on it is less than the discount rate (required rate of return or hurdle rate). This doesn’t necessarily mean the project will “lose money.” It may very well generate accounting profit (net income), but, since the rate of return generated is less than the discount rate, it is considered to destroy value. If the NPV is positive, it creates value. Source
Profit & Loss (P&L) Statement — Formula & Example
The profit & loss statement summarises the revenues and expenses generated by the company over the entire reporting period. The profit & loss statement is also known as the income statement, statement of earnings, statement of operations, or statement of income. The basic equation on which a profit & loss statement is based is Revenues – Expenses = Profit. Source
You might also be interested in our blog – Top 5 Tips for Oncology Forecasting