Trending is one of the key principles that underlay best practice forecasting. Time series trending applies when you have a single data set or one row of data. Briefly, this approach involves plotting historical data against time, and then trending this into the future using an excel generated formula.
We have pulled together an example of how to carry out time series trending within Excel. This can be viewed within the video, or through downloading the related Excel document.
This example aims to walks you through how to trend out historical data within excel, step by step. It will take you through from inputting your historical data, to selecting an appropriate trending curve, and finally to calculating trended data. The example also covers how to convert trend line equations into those recognised by Excel.
If you would like to find out any further information on the principles of trending, the time series trending approach, or other trending methodologies, please visit the training section of theHub or contact us.
When you are creating a sales-based forecast there can be a wide range of sophisticated forecasting tools available to you.
How do you decide on the best methodology and how do you check the appropriateness? Kris Barker, Senior Consultant at J+D Forecasting discusses:
As a starting point, we would recommend using your preferred trending method for all the SKUs/ products/ regimens in your model. This may be a simple growth rate, linear regression, Holt-Winters etc. There are then a couple of checks we would suggest to review the ‘appropriateness’ of your preferred trending option for each product:
1) Review, where applicable, the R-squared value. If this is high, say 60% or above, then you can take comfort in the fact that the trending option selected is doing a reasonable job of using the historic data to predict the future. If this value is low, then this is the first indication that you may want to change your trending option
2) Ultimately, trending algorithms are only mathematical formulas and they cannot think or apply any market understanding that you as the forecaster will possess. As a result, we would certainly recommend reviewing the trending option for any product where the past is not likely to be a very accurate predictor of the future. For example, in cases where a product has only launched in the last 12 months or where a product has had stocking issues over the last 12 months and you know that the volumes are going to ramp up in the coming periods.
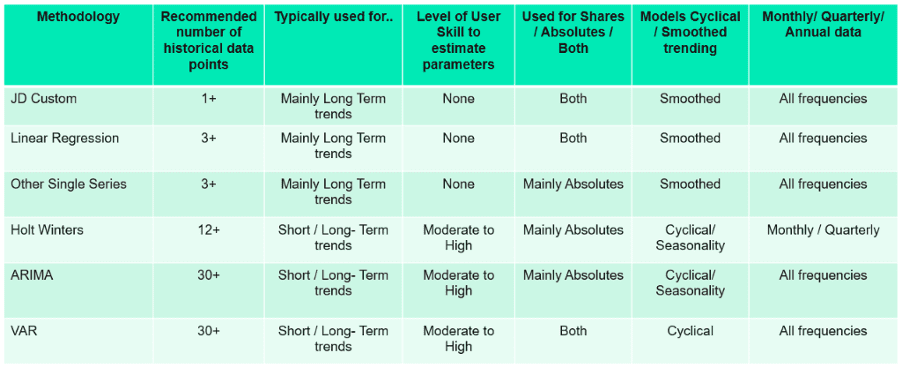
Trending algorithms are a very quick and easy way of creating your baseline forecast, before you then go on to overlay your events. But they cannot think, and the knowledge and expertise of the forecaster cannot and should not be underestimated when it comes to accurately trending the market in a Sales+ forecast model. But as a general rule of thumb, the screen shot below provides an overview of when each of the different trending options should be considered.
If you’d like some help with building forecasting models or would like to discuss our range of excel based forecasting software please contact us or book a demonstration at a time that suits you.
In our latest series of blogs, we’ll be sharing tips and insights gained over the course of our many years of experience.
This post will look at Epidemiology Forecasting, and running a risk analysis on consolidated revenues.
We’ll now hand over to Kris Barker, Senior Consultant here at J+D Forecasting:
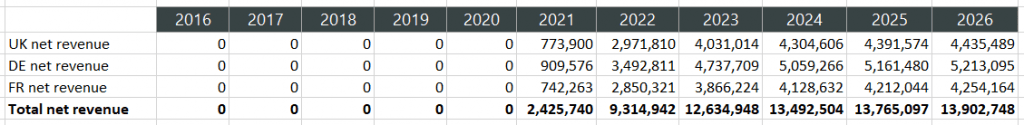
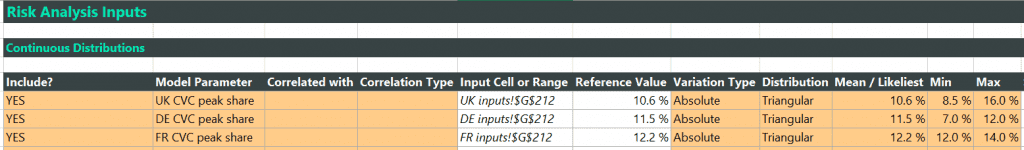
Risk analysis is a very versatile analytical tool available across all the FC+ addins. It may well be the case that you have several forecasts that you have consolidated to create a total, aggregated view of your forecasted revenues. Your next step may then be to create a risk analysis based upon these consolidated revenues and to understand the impact of uncertainty around some of those key variables where your level of knowledge is perhaps not as certain/confident as other input variables. Risk analysis is the perfect tool for this. But to allow you to conduct this analysis on consolidated or aggregated revenues, then there is a very simple additional step required. First of all, the risk analysis section works by selecting input parameters that have a direct or indirect influence on the output variable (e.g. net revenues). Secondly, the output variable needs to a field that is calculated by your forecast model. We need to bear in mind these requirements when conducting our simple additional step. In the example below, you can see that we have created a separate table in our forecast that sums the individual net revenues of the respective countries. As this total net revenue field is a calculated variable, it meets the above requirement. Similarly, as all the input parameters are having an indirect influence on the total net revenue, then this also meets the above requirement. We can now set up and run the risk analysis based on the required input parameters we would like to include and also link this to the total net revenue we have calculated in the simple table we created above. Just click here to take a look at a complete risk analysis we created, which is linked to the above net revenue summary table that you can find on the ‘total net revenue’ tab.
If you are forecasting for an asset across multiple tumour types, forecasting using biomarkers may be a favourable approach for you. Especially if you are factoring in multiple countries and scenarios.
How does this work? Kris Barker, senior consultant at J+D Forecasting explains:
Historically, oncology forecasts have often focussed on a specific tumour type as the basis for how the model is structured and populated. If you have an asset that spans across multiple tumour types, this can make forecasting more challenging (especially if you are also factoring in multiple countries and scenarios).
In more recent times, the focus has become more on the opportunity for the asset rather than the tumour types for which the asset may get a final indication. It may well be the case that an asset in development targets a specific biomarker across a number of tumour types.
BRCA1, as an example, is closely associated with ovarian cancer and to a lesser extent prostate and pancreatic cancer. If you are forecasting an asset that is likely to be closely linked to the BRCA1 biomarker, then it may make more sense to approach your forecast from a biomarker perspective (and to size your potential patient population on those who exhibit this biomarker), than to take an approach based on tumour type.
Download this free example model that demonstrates the above principle.
If you’d like some help with building forecasting models or would like to discuss our range of excel based forecasting software please contact us or book a demonstration at a time that suits you.